Best Paper Award at IJCNN 2018: Maria Huegle, Simon Heller, Manuel Watter, Manuel Blum, Farrokh Manzouri, Matthias Dümpelmann, Andreas Schulze-Bonhage, Peter Woias and Joschka Boedecker
SeizureNet: Early Seizure Detection with an Energy-Efficient Convolutional Neural Network on an Implantable Microcontroller
Paper (arxiv) CiteIntroduction
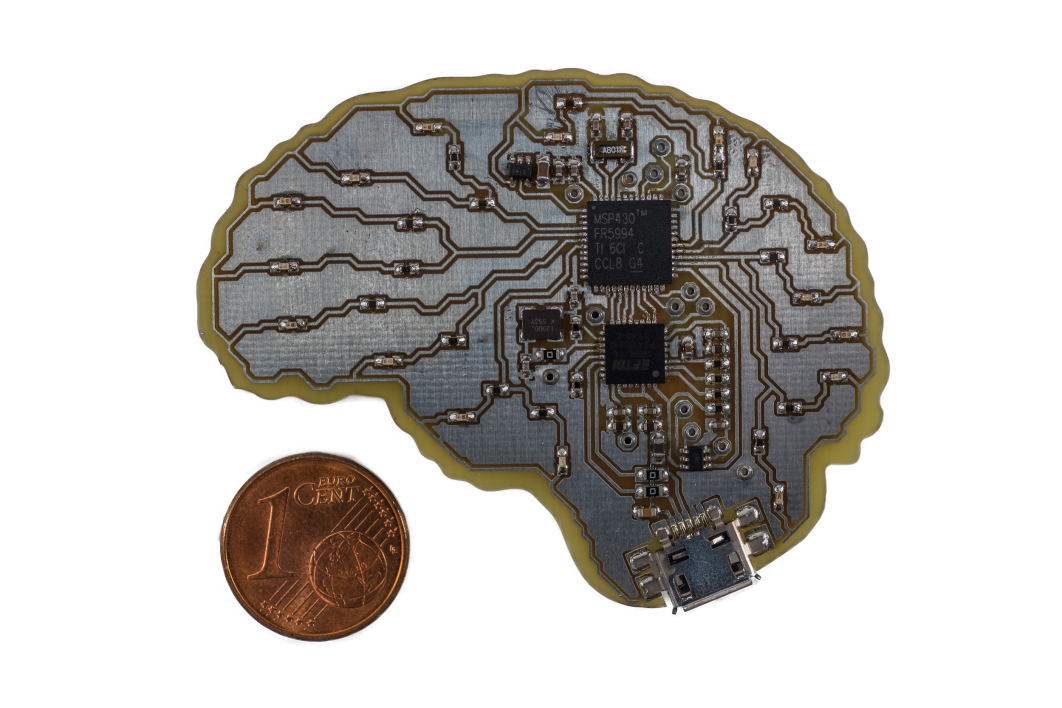 Fig. 1: SeizureNet demonstration device with a Texas Instruments MSP430FR5994 microcontroller (low power consumption, swift FRAM storage, 256KB memory limit, 8 MHz clock speed). © S.Heller
Implantable, closed-loop devices for automated early detection and stimulation of epileptic seizures are promising treatment options for patients with severe epilepsy that cannot be treated with traditional means. Most approaches for early seizure detection in the literature are, however, not optimized for implementation on ultra-low power microcontrollers required for long-term implantation. In this paper we present a convolutional neural network for the early detection of seizures from intracranial EEG signals, designed specifically for this purpose. In addition, we investigate approximations to comply with hardware limits while preserving accuracy. We compare our approach to three previously proposed convolutional neural networks and a feature-based SVM classifier with respect to detection accuracy, latency and computational needs. Evaluation is based on a comprehensive database with long-term EEG recordings. The proposed method outperforms the other detectors with a median sensitivity of 0.96, false detection rate of 10.1 per hour and median detection delay of 3.7 seconds, while being the only approach suited to be realized on a low power microcontroller due to its parsimonious use of computational and memory resources.
Technical Approach
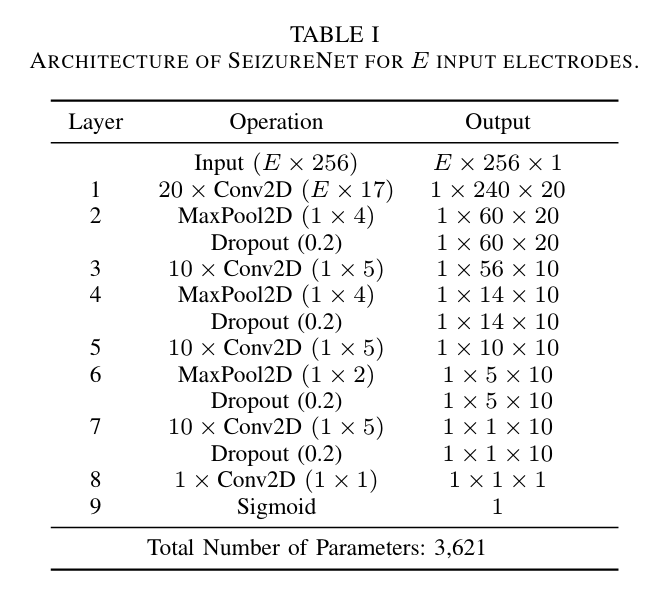
Fig. 2: Architecture of SeizureNet for $E$ input electrodes.
The dataset used is the Epilepsiae database, containing long-term continuous intracranial EEG data. We evaluate our approach on 24 patients. Each recording has a duration between five and eleven days and contains the measurement of approximately 100 intracranial and scalp electrodes originally sampled with or resampled to $f_s = 256\,$Hz. During the two weeks, the evaluated patients had between $6-92$ seizures. To limit the amount of data for our experiments, we consider 100 minutes segments of the recordings around the seizures. For every patient, we consider a subset of $E=4$ electrodes, which are selected a priori by expert epileptologists to cover the seizure onset zone(s). In case that less than four electrodes display the initial ictal EEG pattern, neighboring channels are included for seizure detection. The total number of electrodes is limited due to hardware limitations. In order to find a good model architecture, we evaluated the runtime and memory requirements for various layer types like convolutions, dense layers, pooling layers and activations. The proposed network is a deep convolutional network with alternating convolutional and pooling layers, shown in Fig. 2.
Hardware
For the hardware implementation of the network, a low power microcontroller MSP430FR5994 from Texas Instruments is used, shown in Fig. 1. Due to its power consumption of 118$\,\mu$A/MHz in active mode and 0.5$\,\mu$A in standby mode, it is suitable for the application in an implantable device where a heating of the surrounding tissue must be avoided. A further great advantage of the MSP430FR series is its ferromagnetic nonvolatile memory (FRAM). With a low-power consumption and fast write speed, a swift storage of hidden layer activations of a neural network can be implemented. However, the FRAM also limits the maximum clock speed of the controller as its reading speed is limited to $8$ MHz. It is possible to run the controller with higher clock speeds but only with additional wait states for the CPU leading to a lower power efficiency. Another useful feature for the implementation of convolution layers is the $32$-bit hardware multiplier of the controller, enabling power efficient multiply and accumulate (MAC) operations without CPU intervention.
Seizure Detection Performance Evaluation
It is non-trivial to evaluate a seizure detection system. Mainly, three objectives should be optimized:
- The sensitivity is defined as the ratio of actually detected seizures to the total number of seizures.
- The detection delay is calculated as the mean delay over all detected seizures. For each detected seizure, the delay is defined as the expired time between the electrographic seizure onset identified through visual inspection by a domain expert, and the first algorithm-based detection of the seizure.
- The false positive rate is the number of false detections per hour (fp/h).
Results
The detection performance of SeizureNet is shown in Fig. 3 over all patients, with memory and runtime requirements shown in Fig. 4. With the best median AUC score of $0.89$ and a good balance between false positives and delay, SeizureNet shows the best and most robust detection performance.
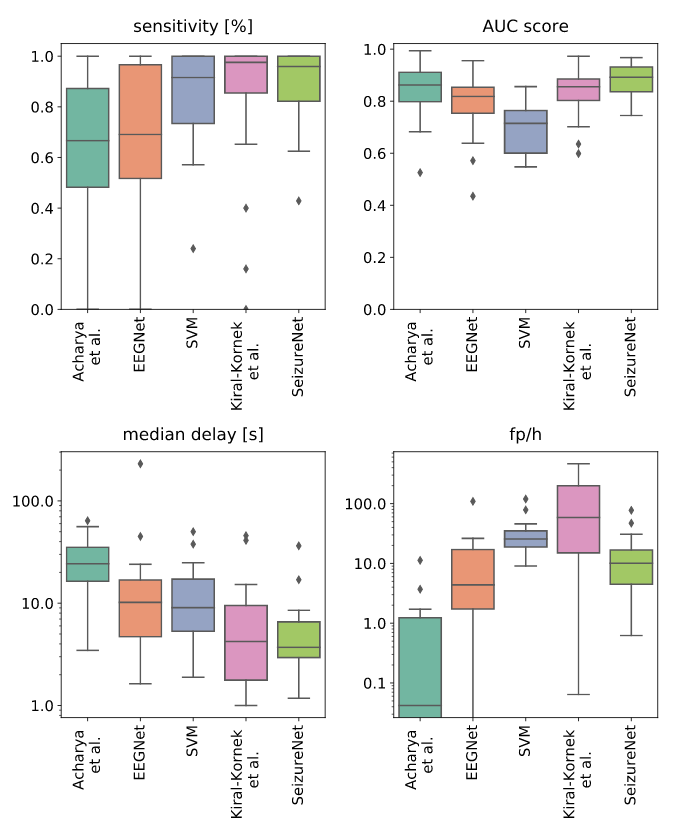
Fig 3: Detection performances over all patients for a classifier threshold of $0.5$.
Median delay and false positive rate are shown in logarithmic scale.
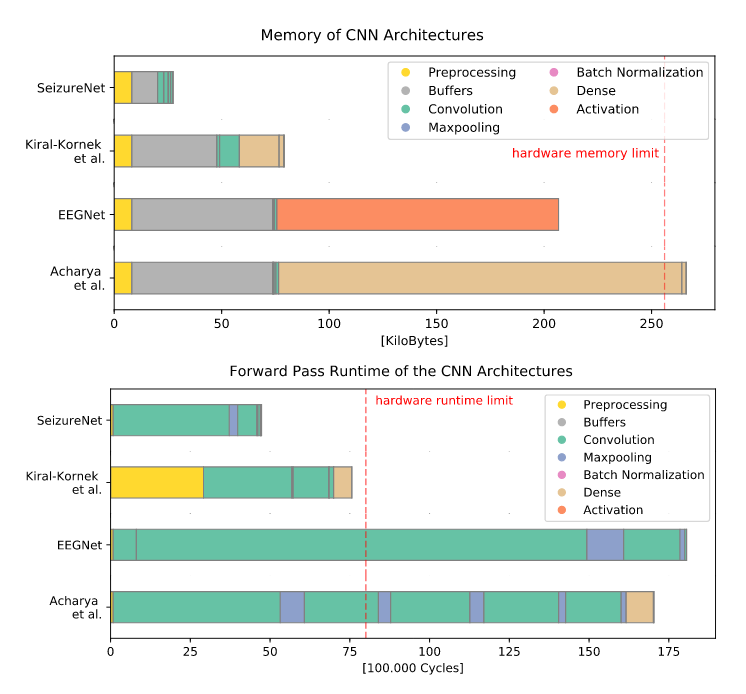
Fig 4: Memory (top) and runtime (bottom) requirements for SeizureNet and the baseline
architectures. Runtime blocks are ordered according to their execution
in the forward pass. Layers with few parameters or cycles are not visible.
The predictions for the repetitive spiking pattern is shown in Fig. 5:
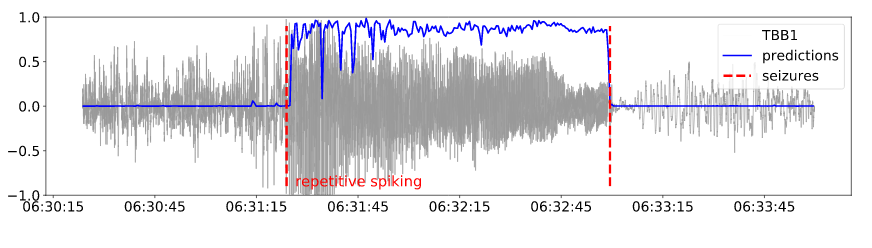
Fig. 5: Early detected seizure with the repetitive spiking onset pattern: predictions one minute
around the seizures and the normalized electrode signal of one electrode.
Demonstration
Video explaining the SeizureNet Demonstration Device.
BibTeX
@INPROCEEDINGS{8489493,
author={M. {Huegle} and S. {Heller} and M. {Watter} and
M. {Blum} and F. {Manzouri} and M. {Duempelmann}
and A. {Schulze-Bonhage} and P. {Woias} and J. {Boedecker}},
booktitle={2018 International Joint Conference on Neural Networks (IJCNN)},
title={Early Seizure Detection with an Energy-Efficient Convolutional
Neural Network on an Implantable Microcontroller},
year={2018},
volume={},
number={},
pages={1-7},
}
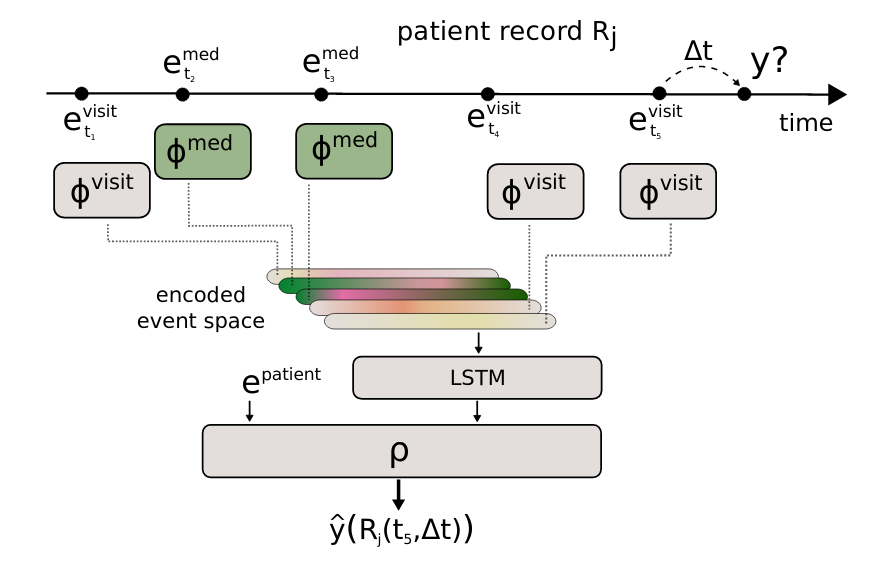 Fig. 1: Scheme of AdaptiveNet, which projects visits and medication adjustments to the same latent space using encoder networks $\phi^{\text{visit}}$ and $\phi^{\text{med}}$, where the output vectors $\phi^{(\cdot)}{(\cdot)}$ have the same length. The sorted list of encoded events are pooled by an LSTM to compute a fixed-length encoded patient history. The final output $\hat y$ is computed by the network module $\rho$.}
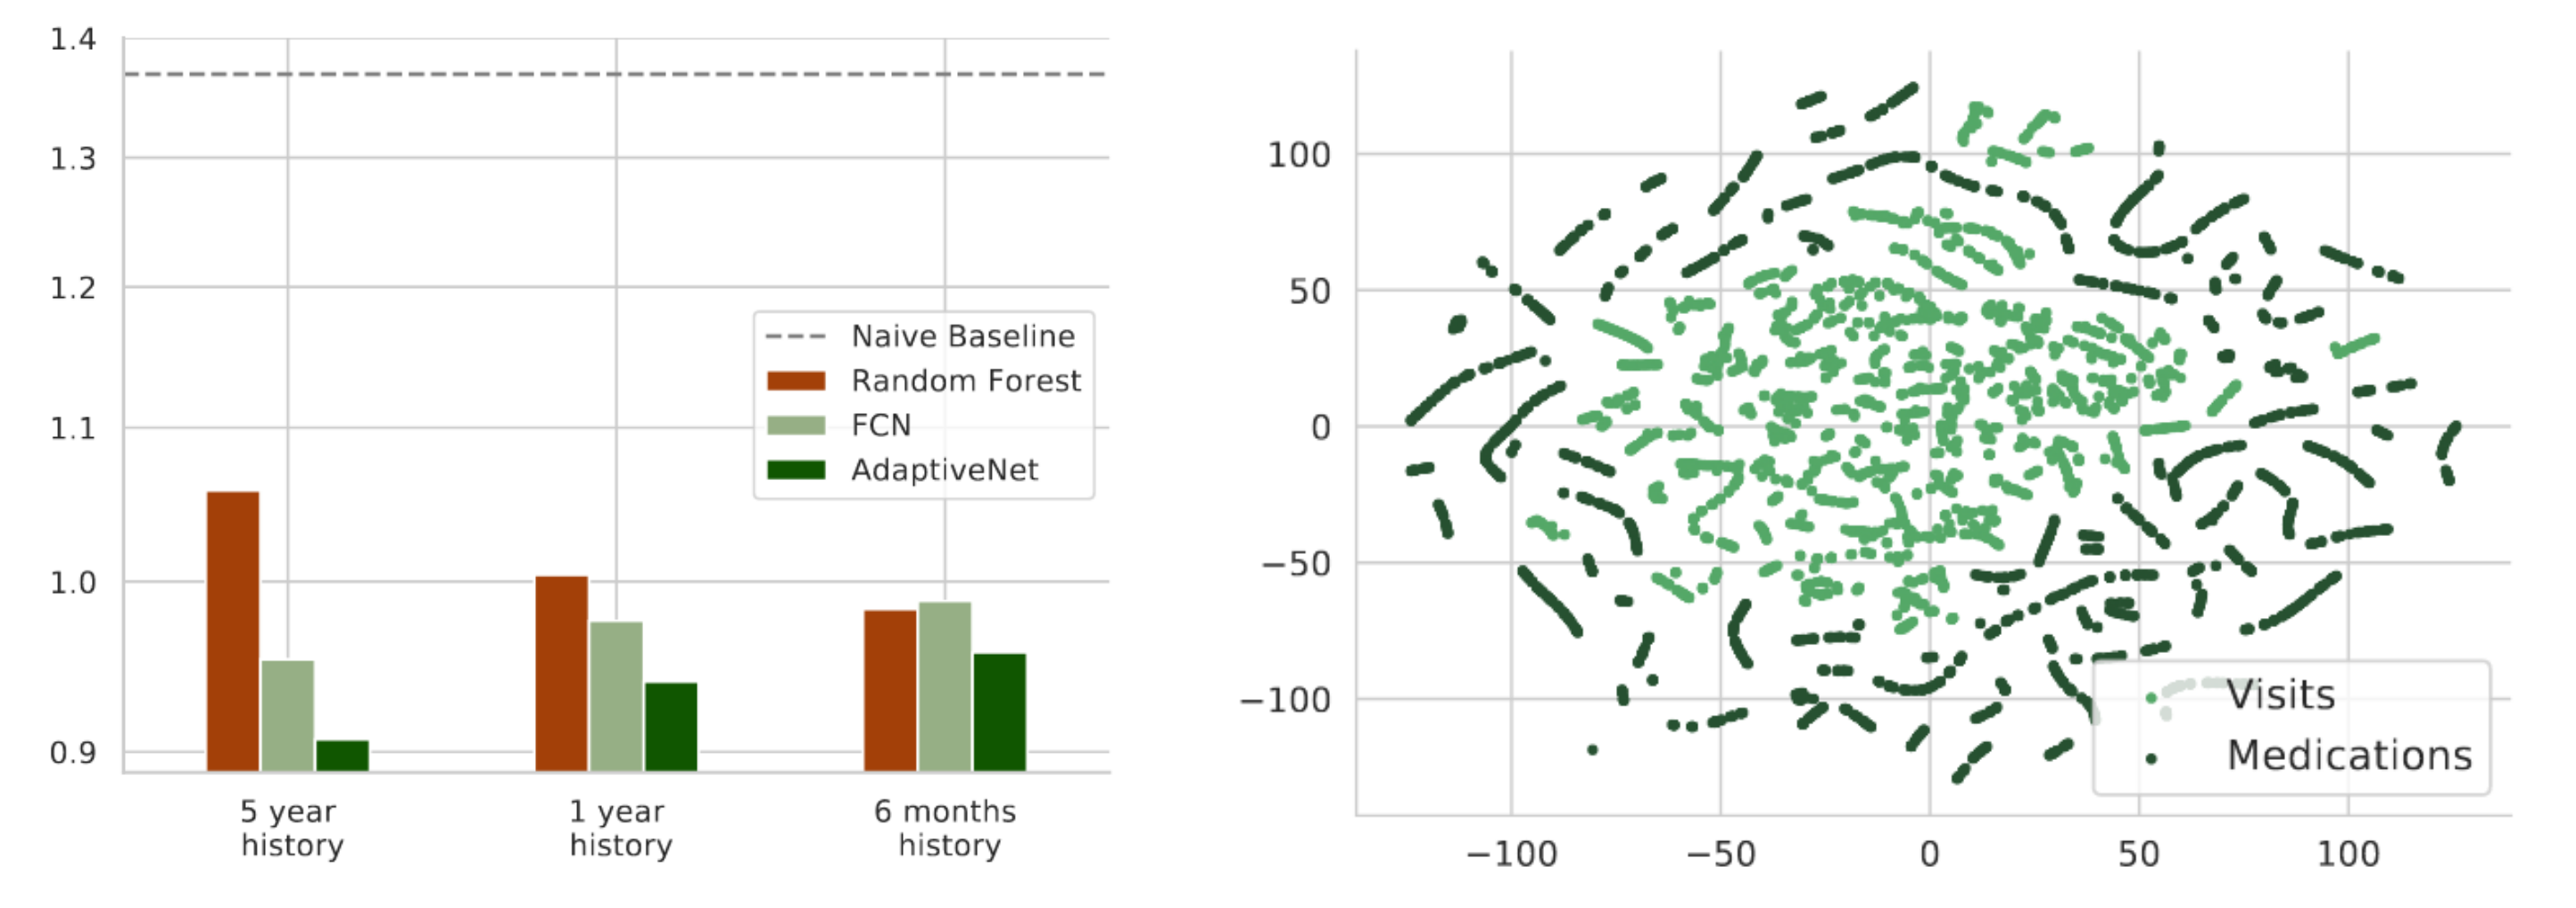 Fig. 2: Mean squared error of the disease progression prediction for different maximum history lengths in a range from 5 years